/
Using charts gadget
Using charts gadget
By Piotr Bojko
Jan 16, 2019
For using a charts gadget you will need a view as data feed. This view can be either a custom view you created or a shared view you have access. See Managing saved queries / views for greater details on this.
Placing a gadget on a dashboard
Smart QL app offers gadget which you can manage as any other Jira dashboard gadgets. You can for example:
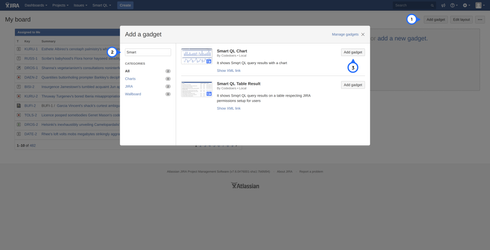
- On your desired dashboard choose Add gadget
- Look for the Smart. Consider that sometimes you have to expand gadget list by clicking Load all gadgets.
- Choose appropriate gadget.
Configuring chart gadget
.png?version=1&modificationDate=1547639327020&cacheVersion=1&api=v2&width=516&height=250)
- View. Each chart needs data. Smart QL uses views as a data feed for any chart. You can use any view created by you or shared with you.
- Chart. Several chart types are supported: Scatterplot, Line, Bar, Horizontal bar, Horizontal stacked bar, Stacked bar, Stacked area.
- X. Column from the selected view which will be mapped to values for X axis.
- Y. Column from the selected view which will be mapped to values for X axis.
- Color. Column from the selected view, mapped to color gradient of a specific XY point for a row.
- Size. Column from the selected view, mapped to size of a specific XY point for a row.
Examples
How many task type I have opened in different projects.
.png?version=1&modificationDate=1547640374552&cacheVersion=1&api=v2&width=513&height=249 "Configuration")
.png?version=1&modificationDate=1547640388681&cacheVersion=1&api=v2&width=457&height=250 "Result")
, multiple selections available,